Demystifying Observability: Gaining Deep Insights into Your Distributed Application with OpenTelemetry and Broadleaf Commerce
Written byJeff Fischer
Published onMay 20, 2025
In modern microservice computing environments, maintaining optimal performance and understanding the intricate workings of your applications is paramount. Traditional monitoring methods often fall short when dealing with distributed systems, leaving developers and operators grappling in the dark when issues arise. This is where observability comes into play, offering a powerful paradigm shift towards understanding and managing software.
But what is observability, and how does it revolutionize our ability to monitor and improve our systems? Moreover, how can OpenTelemetry, and Broadleaf Commerce's tailored integration amplify our insights? In this blog, we will explore the concepts of observability, delve into the capabilities of OpenTelemetry, and examine how Broadleaf Commerce leverages it to provide an enhanced view of your application’s performance and health.
What is Observability?
At its core, observability is the ability to understand the internal state of a system by examining its external outputs. Unlike traditional monitoring, which often relies on predefined metrics and logs, observability encourages the collection and analysis of a wider range of data, including traces, metrics, and logs. This holistic approach allows us to ask and answer complex questions about system behavior, even those that were initially unanticipated.
Observability is about more than just knowing that something happened; it's about understanding why it happened. This proactive approach is crucial for maintaining system health, optimizing performance, and ensuring a seamless customer experience.
The Three Pillars of Observability
Observability is built on three key pillars that provide a comprehensive view of system behavior:
Metrics: Numerical measurements of data over time, such as CPU usage, memory consumption, and response latency. Metrics offer a high-level overview of system performance and help identify trends and anomalies.
Logs: Time-stamped records of events within the system, including error messages, application events, and audit trails. Logs provide detailed insights into individual occurrences and can help pinpoint root causes.
Traces: End-to-end records of requests as they propagate through a distributed system, capturing the flow of execution across multiple services. Traces are crucial for understanding dependencies and identifying performance bottlenecks.
Together, these pillars provide a complete and nuanced picture of how a system is operating. Metrics offer a broad view, logs provide detailed event-level data, and traces connect the dots to show the entire journey of a request.
Introducing OpenTelemetry
Implementing effective observability can be challenging, particularly in complex environments. This is where OpenTelemetry enters the scene. OpenTelemetry is an open-source project under the Cloud Native Computing Foundation (CNCF) that offers a vendor-neutral, standardized method for collecting, processing, and exporting telemetry data.
OpenTelemetry addresses the fragmentation in observability by providing a unified set of APIs, libraries, and tools for instrumenting applications and gathering telemetry data. By using OpenTelemetry, developers can instrument their code once and then select from various backends for analysis and visualization, eliminating vendor lock-in and simplifying the creation of robust observability pipelines.
Key Advantages of OpenTelemetry
OpenTelemetry offers several significant benefits:
Vendor Neutrality: Allows switching between analysis backends without needing to re-instrument code.
Standardization: Provides a consistent approach to application instrumentation and telemetry data collection.
Flexibility: Supports multiple languages, protocols, and data formats.
Community-Driven: Backed by a vibrant open-source community that continually enhances and improves the project.
Low Instrumentation Overhead: Designed for efficiency, minimizing performance impact on applications.
By adopting OpenTelemetry, organizations can streamline their observability initiatives, reduce complexity, and gain deeper visibility into their systems.
Broadleaf Commerce and OpenTelemetry: A Perfect Match
Recognizing the importance of observability for maintaining a reliable, high-performing e-commerce platform, Broadleaf Commerce has integrated native support for OpenTelemetry. This empowers developers and operators to effectively monitor and manage their Broadleaf deployments.
Broadleaf Commerce aligns with the OpenTelemetry specifications and open-source components for exporting application health, logging, and performance signals. With widespread support for OpenTelemetry among Application Performance Monitoring (APM) products, Broadleaf can interact with any chosen APM, providing tailored performance data specific to Broadleaf implementations. Furthermore, Broadleaf's OpenTelemetry support is customizable, enabling the addition of new logs, metrics, and trace information beyond the default offerings.
Broadleaf's JavaAgent Instrumentation: Customized for E-Commerce
The core of Broadleaf's OpenTelemetry integration is its specialized JavaAgent instrumentation. This agent attaches at runtime to record execution flow traces, extract health metrics, and export logs. These data points are correlated, meaning you can seamlessly identify specific logs related to a particular execution trace. All data is communicated via the OTLP protocol.
Broadleaf's JavaAgent is specifically tailored to the unique requirements of Broadleaf e-commerce platforms, capturing data that is essential for understanding and troubleshooting Broadleaf deployments, including:
User and Account Auditing: Trace data includes detailed user actions and account activity for enhanced auditing.
Broadleaf-Specific Flows: Key Broadleaf processes are instrumented for deeper performance insights.
Deeper Metrics: Resource insights go beyond the standard offering, including cache and connection pool utilization.
Customizability: The JavaAgent can be customized to add project-specific logs, metrics, and traces.
This tailored approach offers a significant advantage, enabling Broadleaf users to gain insights that might be missed with generic OpenTelemetry implementations.
Key Concepts of Broadleaf's OpenTelemetry Integration
Here are some key concepts underlying Broadleaf's OpenTelemetry integration:
JavaAgent: Attached at runtime, it handles trace recording, metric extraction, and log export, ensuring correlated data via OTLP.
OpenTelemetry Collector: Receives OTLP data, optionally processes it, and exports it to a backend APM or another collector.
Broadleaf OpenTelemetry Starter: Essential for enabling the JavaAgent, easily added to the project's classpath.
Reference APM and Visualizations
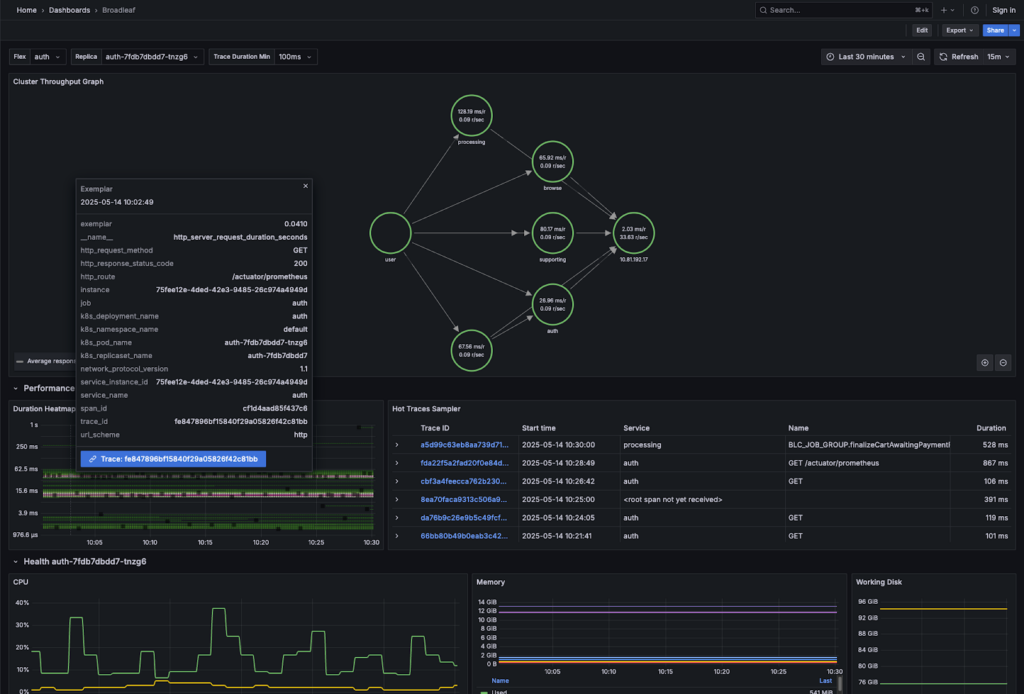
Broadleaf provides a reference dashboard for visualizing system health. This dashboard, based telemetry harvested via OTLP and Prometheus, includes:
Cluster Throughput Graph: Shows execution components, throughput, and success/error rates.
Performance: Features a Duration Heatmap and Hot Traces Sampler.
Health: Displays metrics like CPU, Memory, Disk, GC activity, Threads, and Thread States.
Connection Pool: Shows the status of the DB connection pool, including acquire and usage times.
Cache: Visualizes Apache Ignite cache metrics like hit ratio, member count, off-heap usage, and get/put rates.
These visualizations provide critical insights into the overall health and performance of your Broadleaf application. The following example visualization focuses on system health and performance, giving insight into throughput and resource utilization. Correlations to traces are also provided here (Hot Trace Samples and exemplars in the Duration Heatmap). Many other visualizations and research tools are exposed in the reference APM.
Figure 1 : Reference Dashboard
JavaAgent Customization
Broadleaf's OpenTelemetry JavaAgent is built on the official OpenTelemetry JavaAgent with enhancements for Broadleaf-specific needs. While sufficient out-of-the-box, further customization is possible.
Developers can customize the agent by:
Setting Spring environment properties for OpenTelemetry agent configurations.
Adding or removing classes/methods from instrumentation eligibility.
Introducing custom Spans using `ObservationBuilderFactory` implementations.
Customizing metrics reported via OTLP by leveraging Micrometer.
These customization options provide flexibility to tailor observability to specific project requirements.
Conclusion
Observability is crucial for understanding and managing complex systems, and OpenTelemetry provides a powerful, standardized toolset. Broadleaf Commerce's seamless integration with OpenTelemetry, including its customized JavaAgent, empowers you to gain deep insights into your platform. By leveraging these capabilities, you can ensure optimal performance, proactively address issues, and deliver exceptional customer experiences.